A Journal for Your Downtime
The Logbook keeps a record of everything you finish. Over time, it turns into charts, insights, and fun facts about how you spend your downtime.
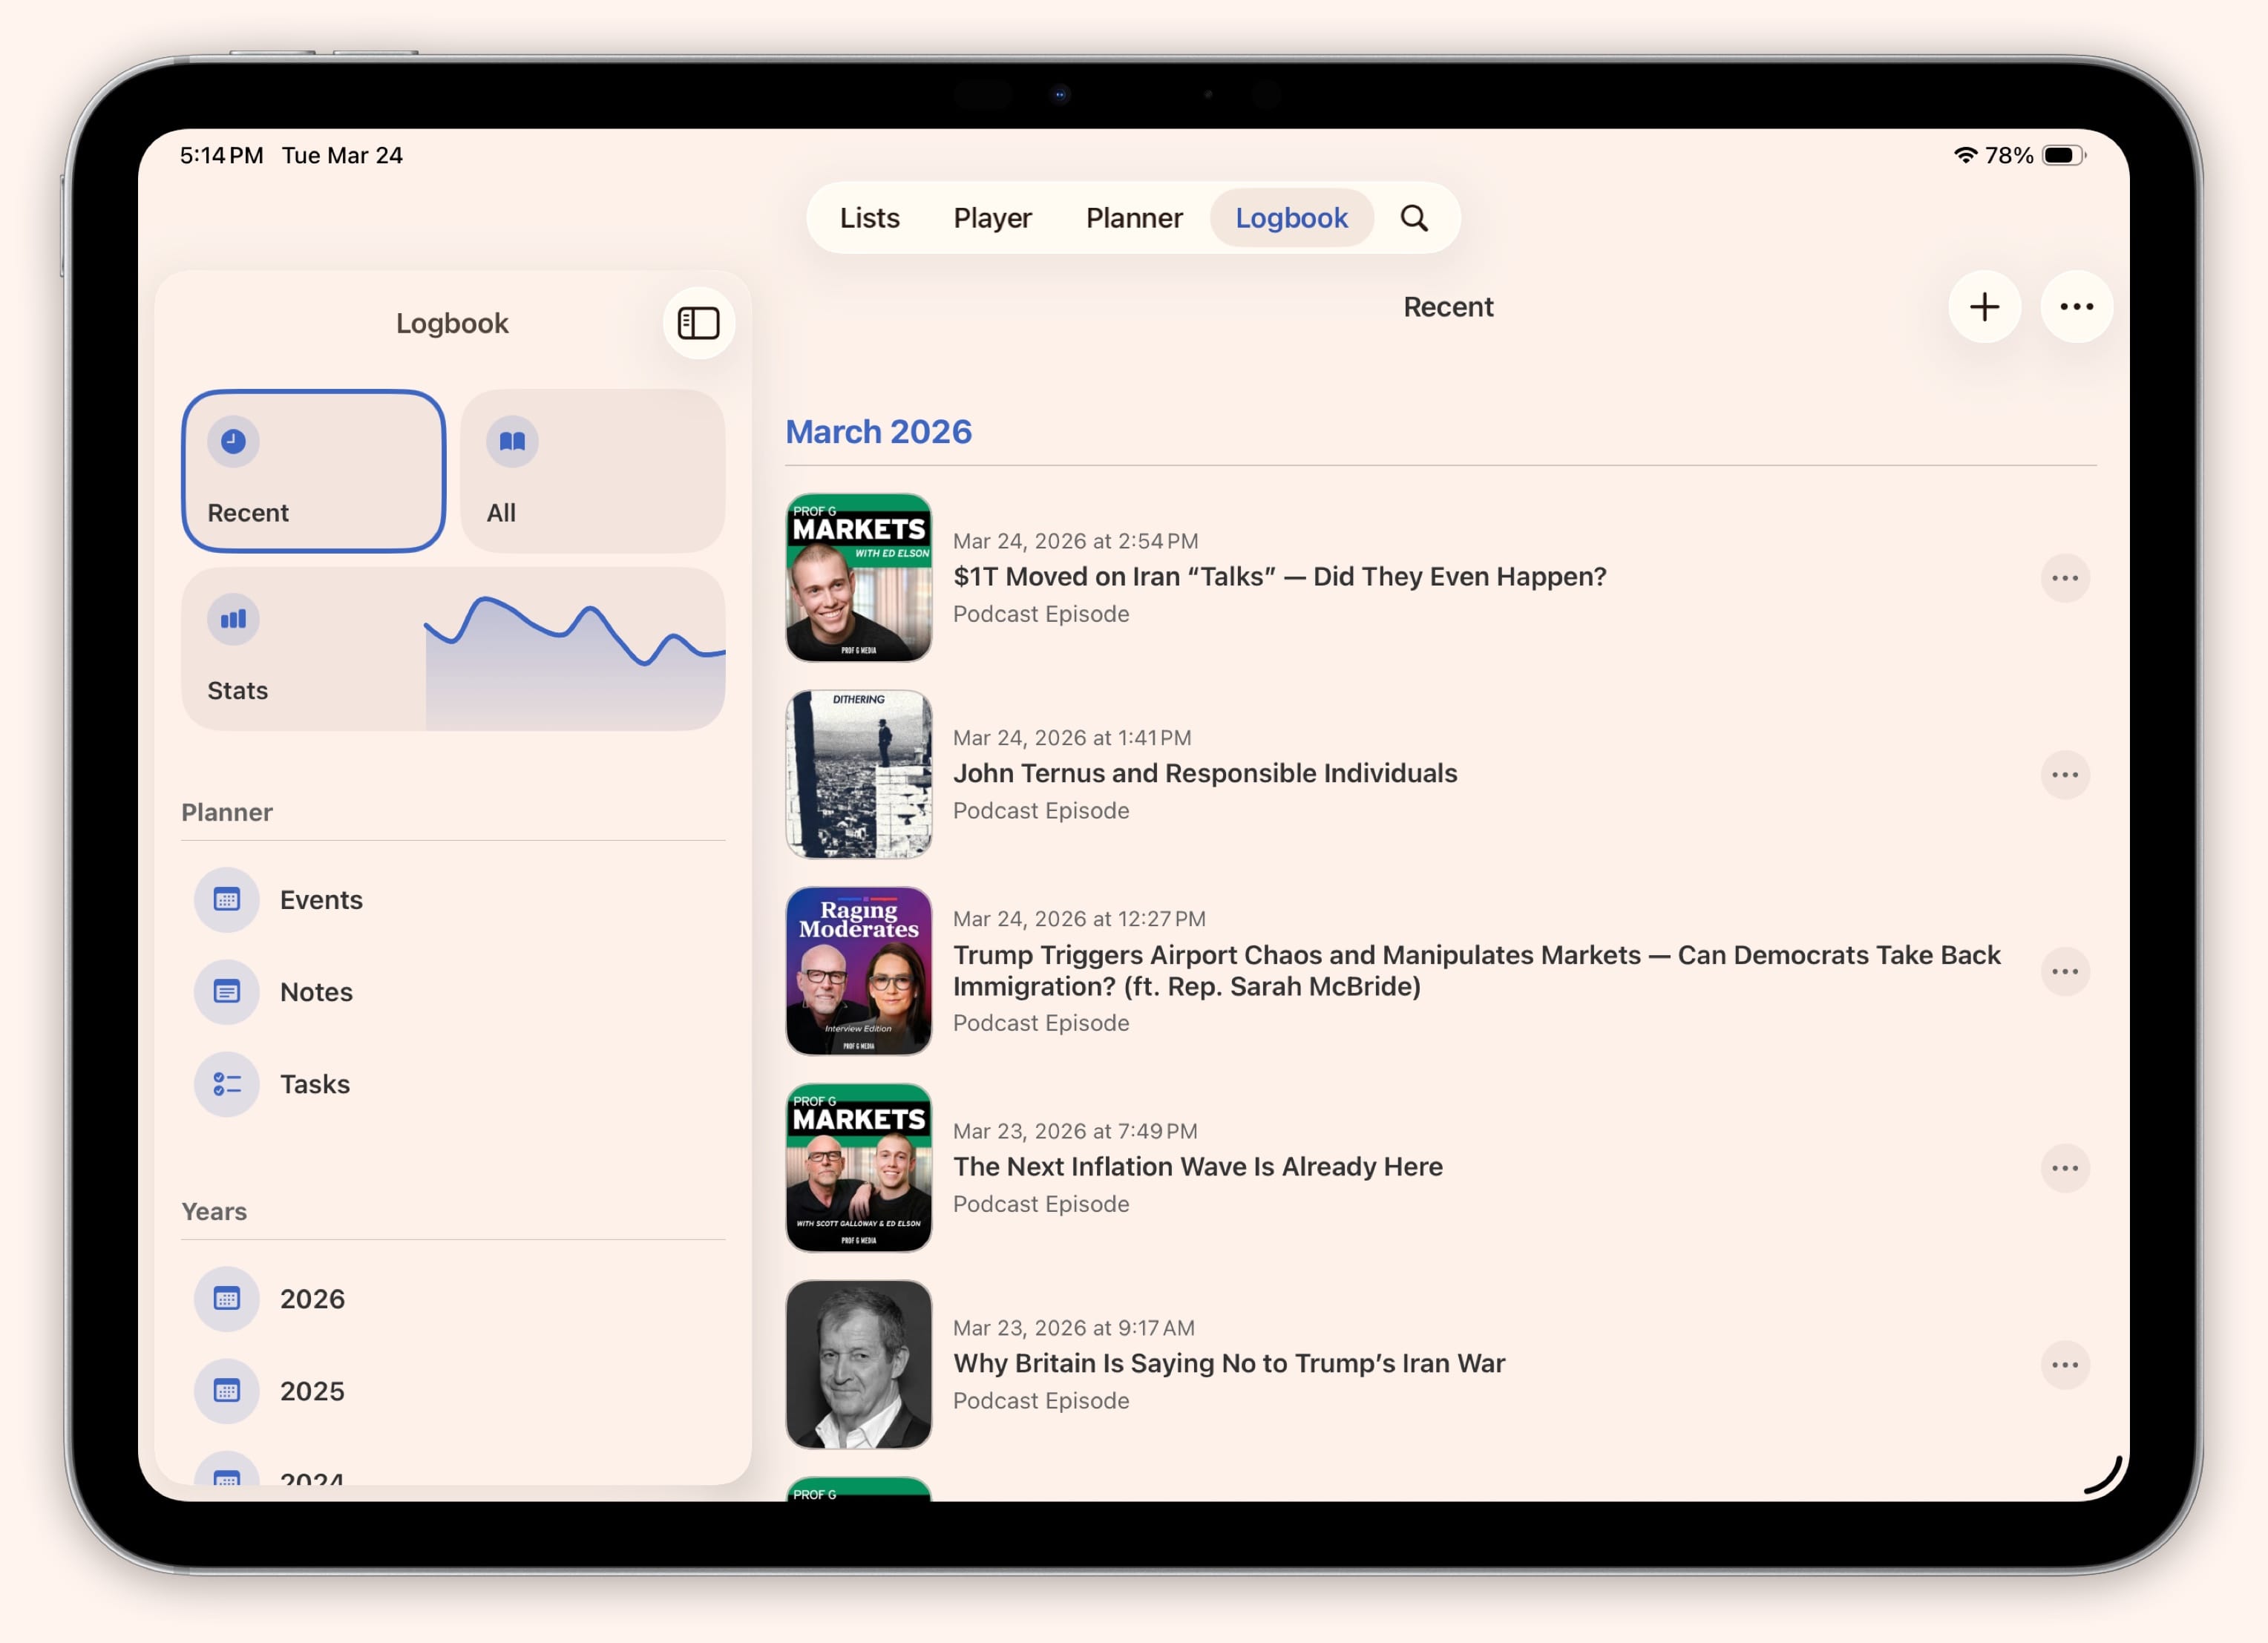
Everything You Finish Lives in the Logbook
You finish a show and it just sort of disappears. You read a book last summer but can not remember when exactly, or what you thought of it at the time. The Logbook in Sofa catches everything. Mark something as complete and it lands in your history with its date, notes, and metadata intact. Your Logbook item and your list item are the same thing, so edits stay in sync everywhere.
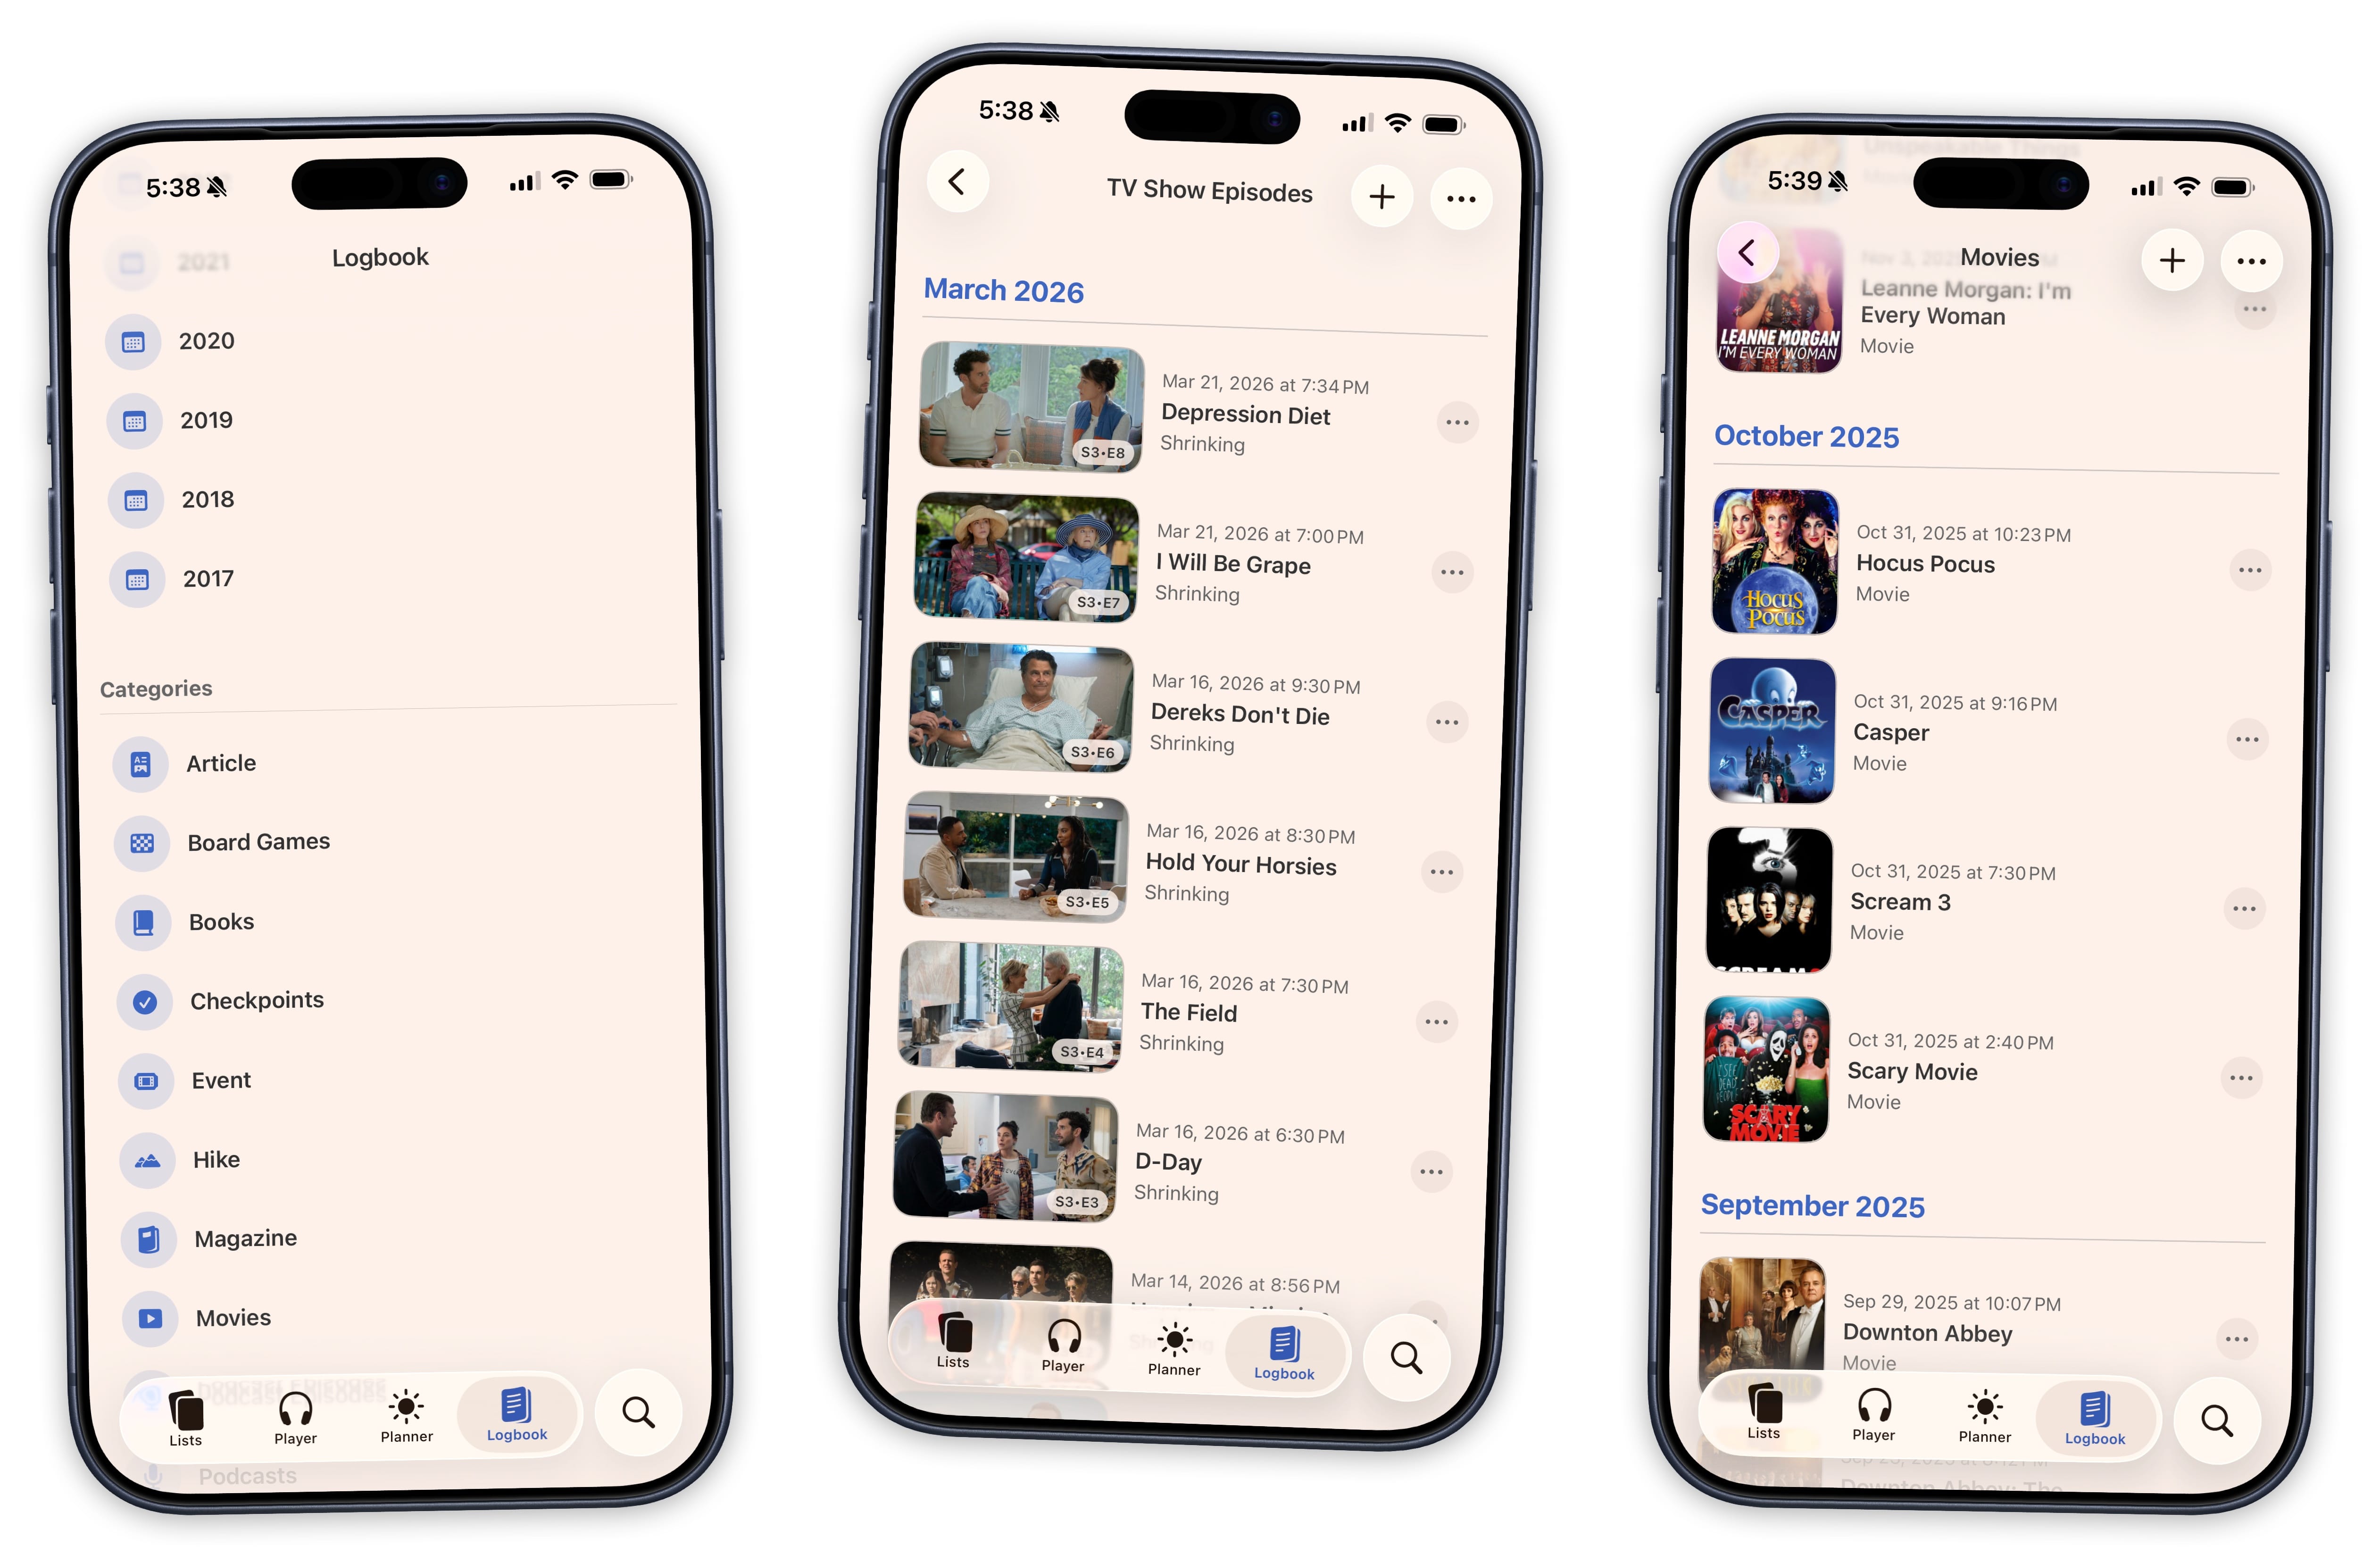
You can also add things directly to the Logbook from search. Saw a movie in theaters last week? Log it now with the date you watched it. Changed your mind about when you finished a book? Edit the date anytime. The Logbook is forgiving about the past.
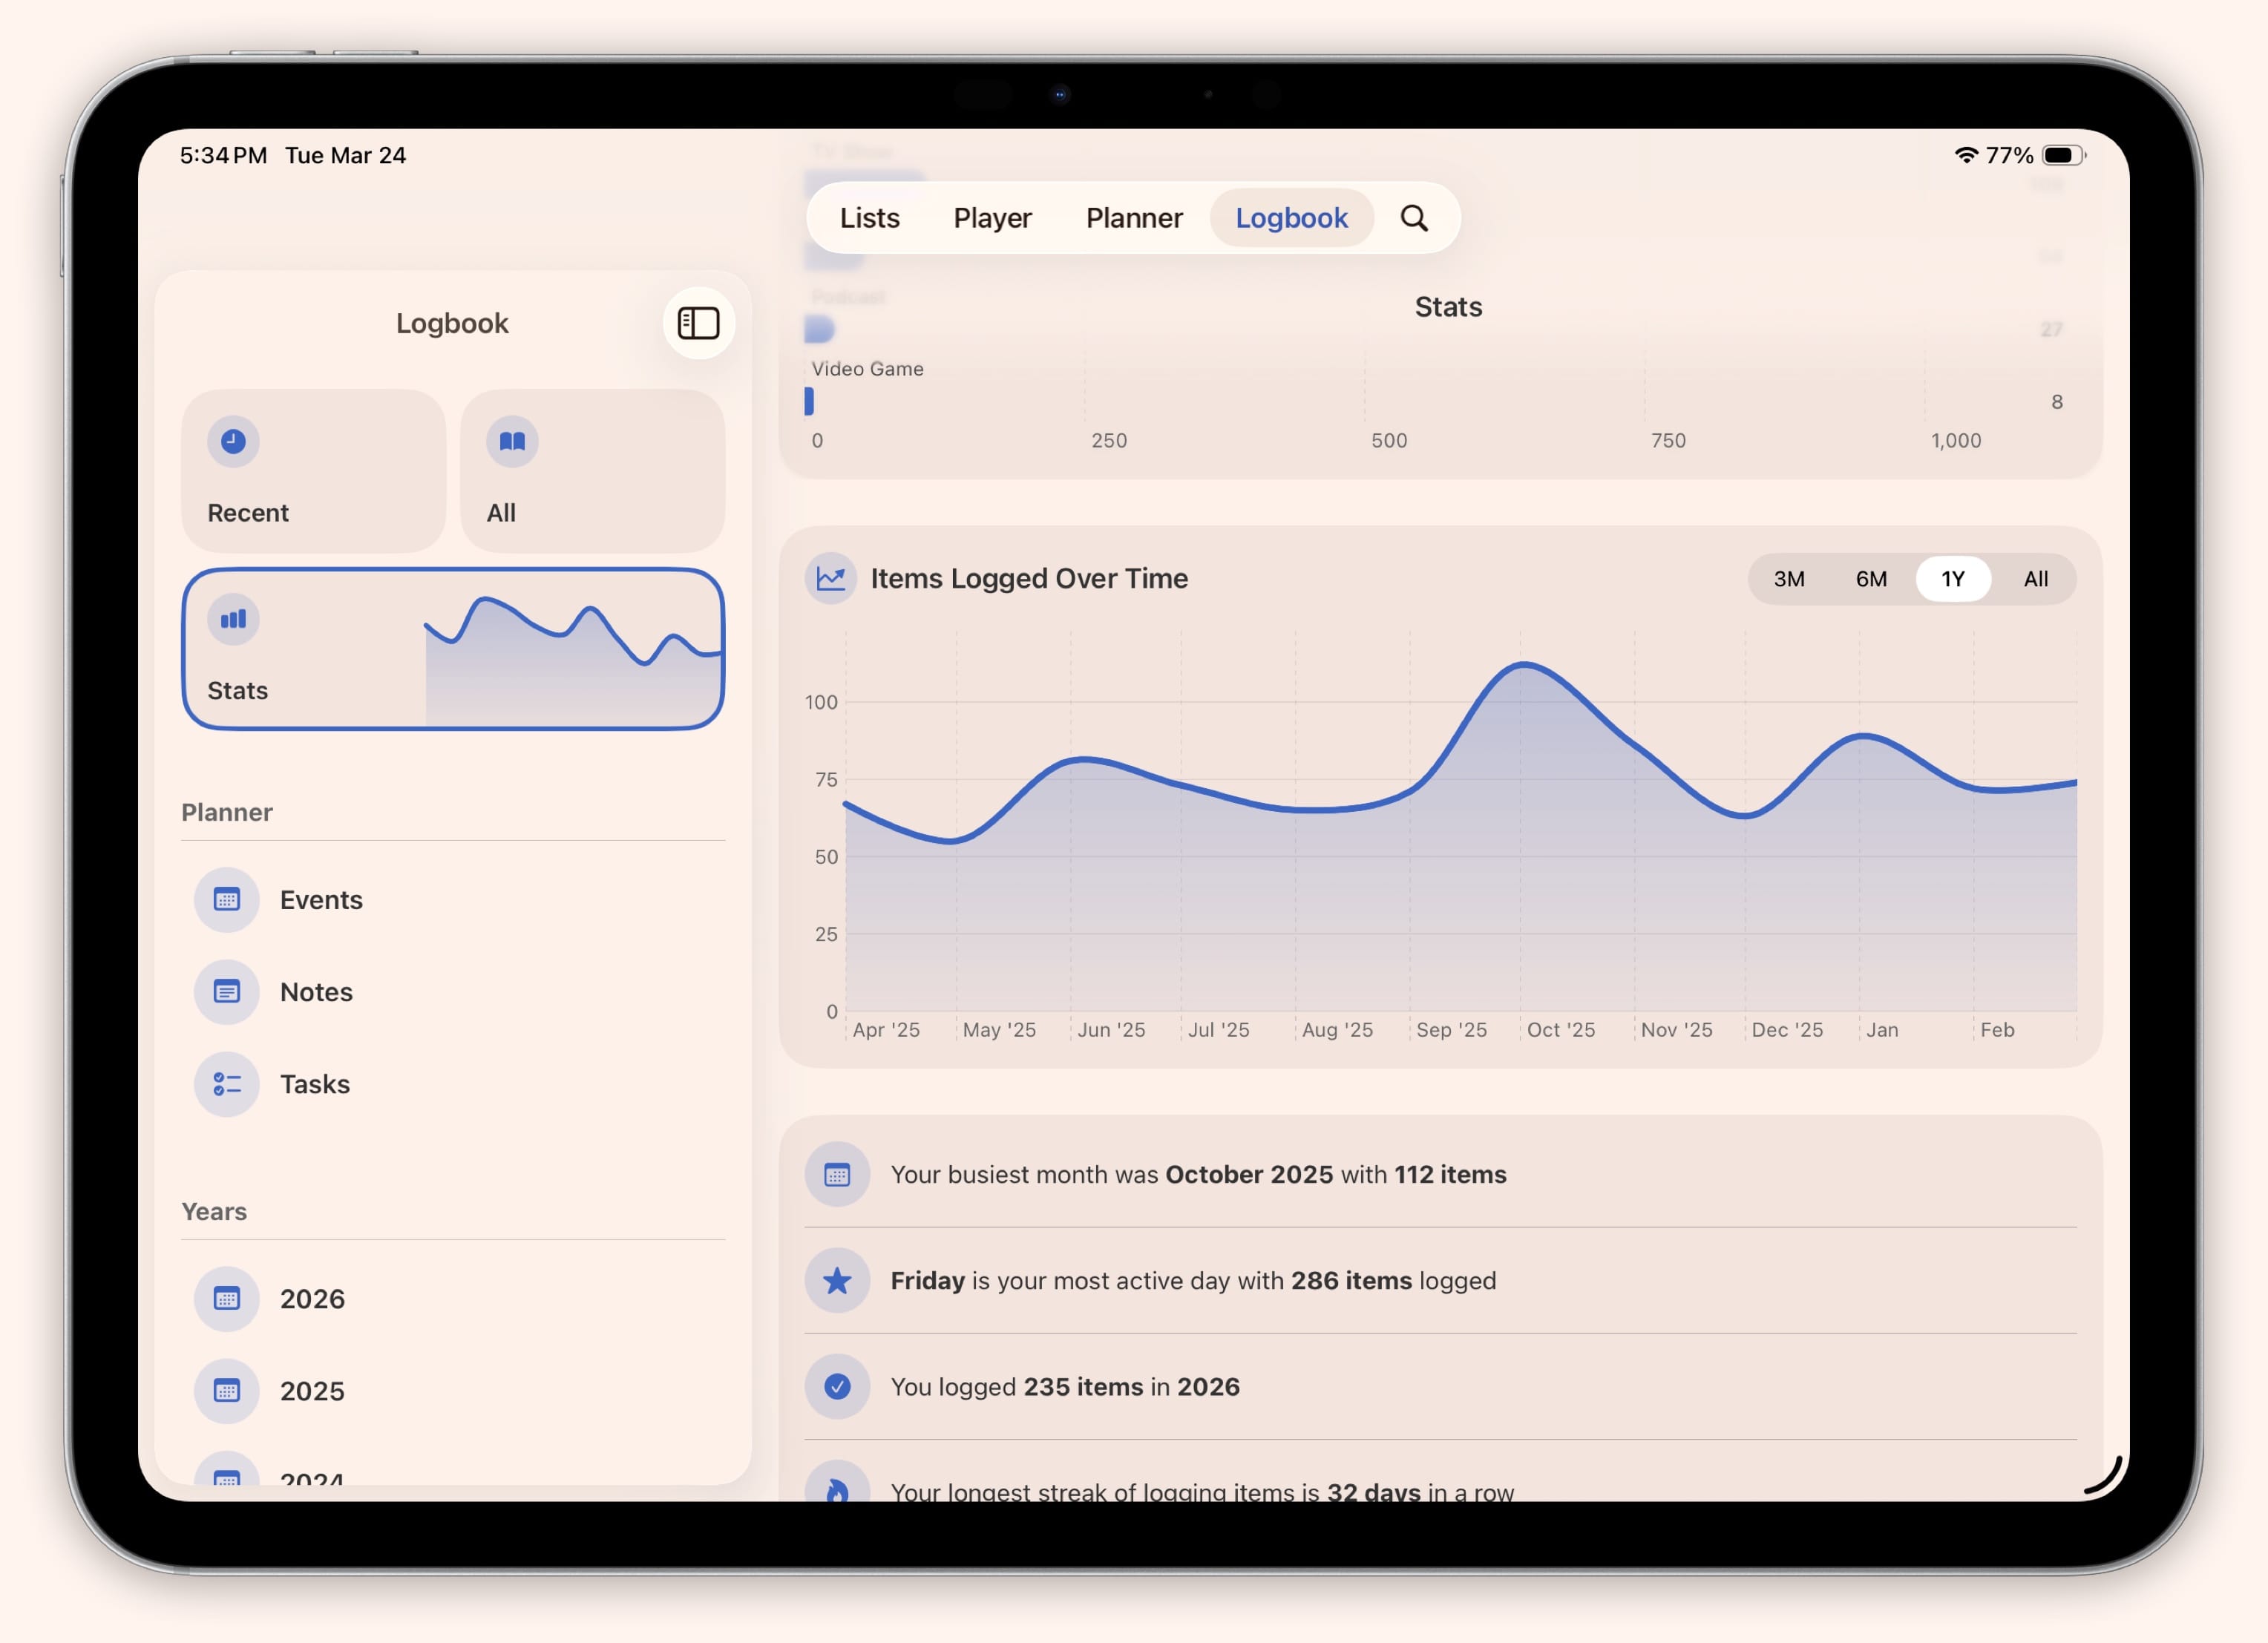
Your History, in Charts
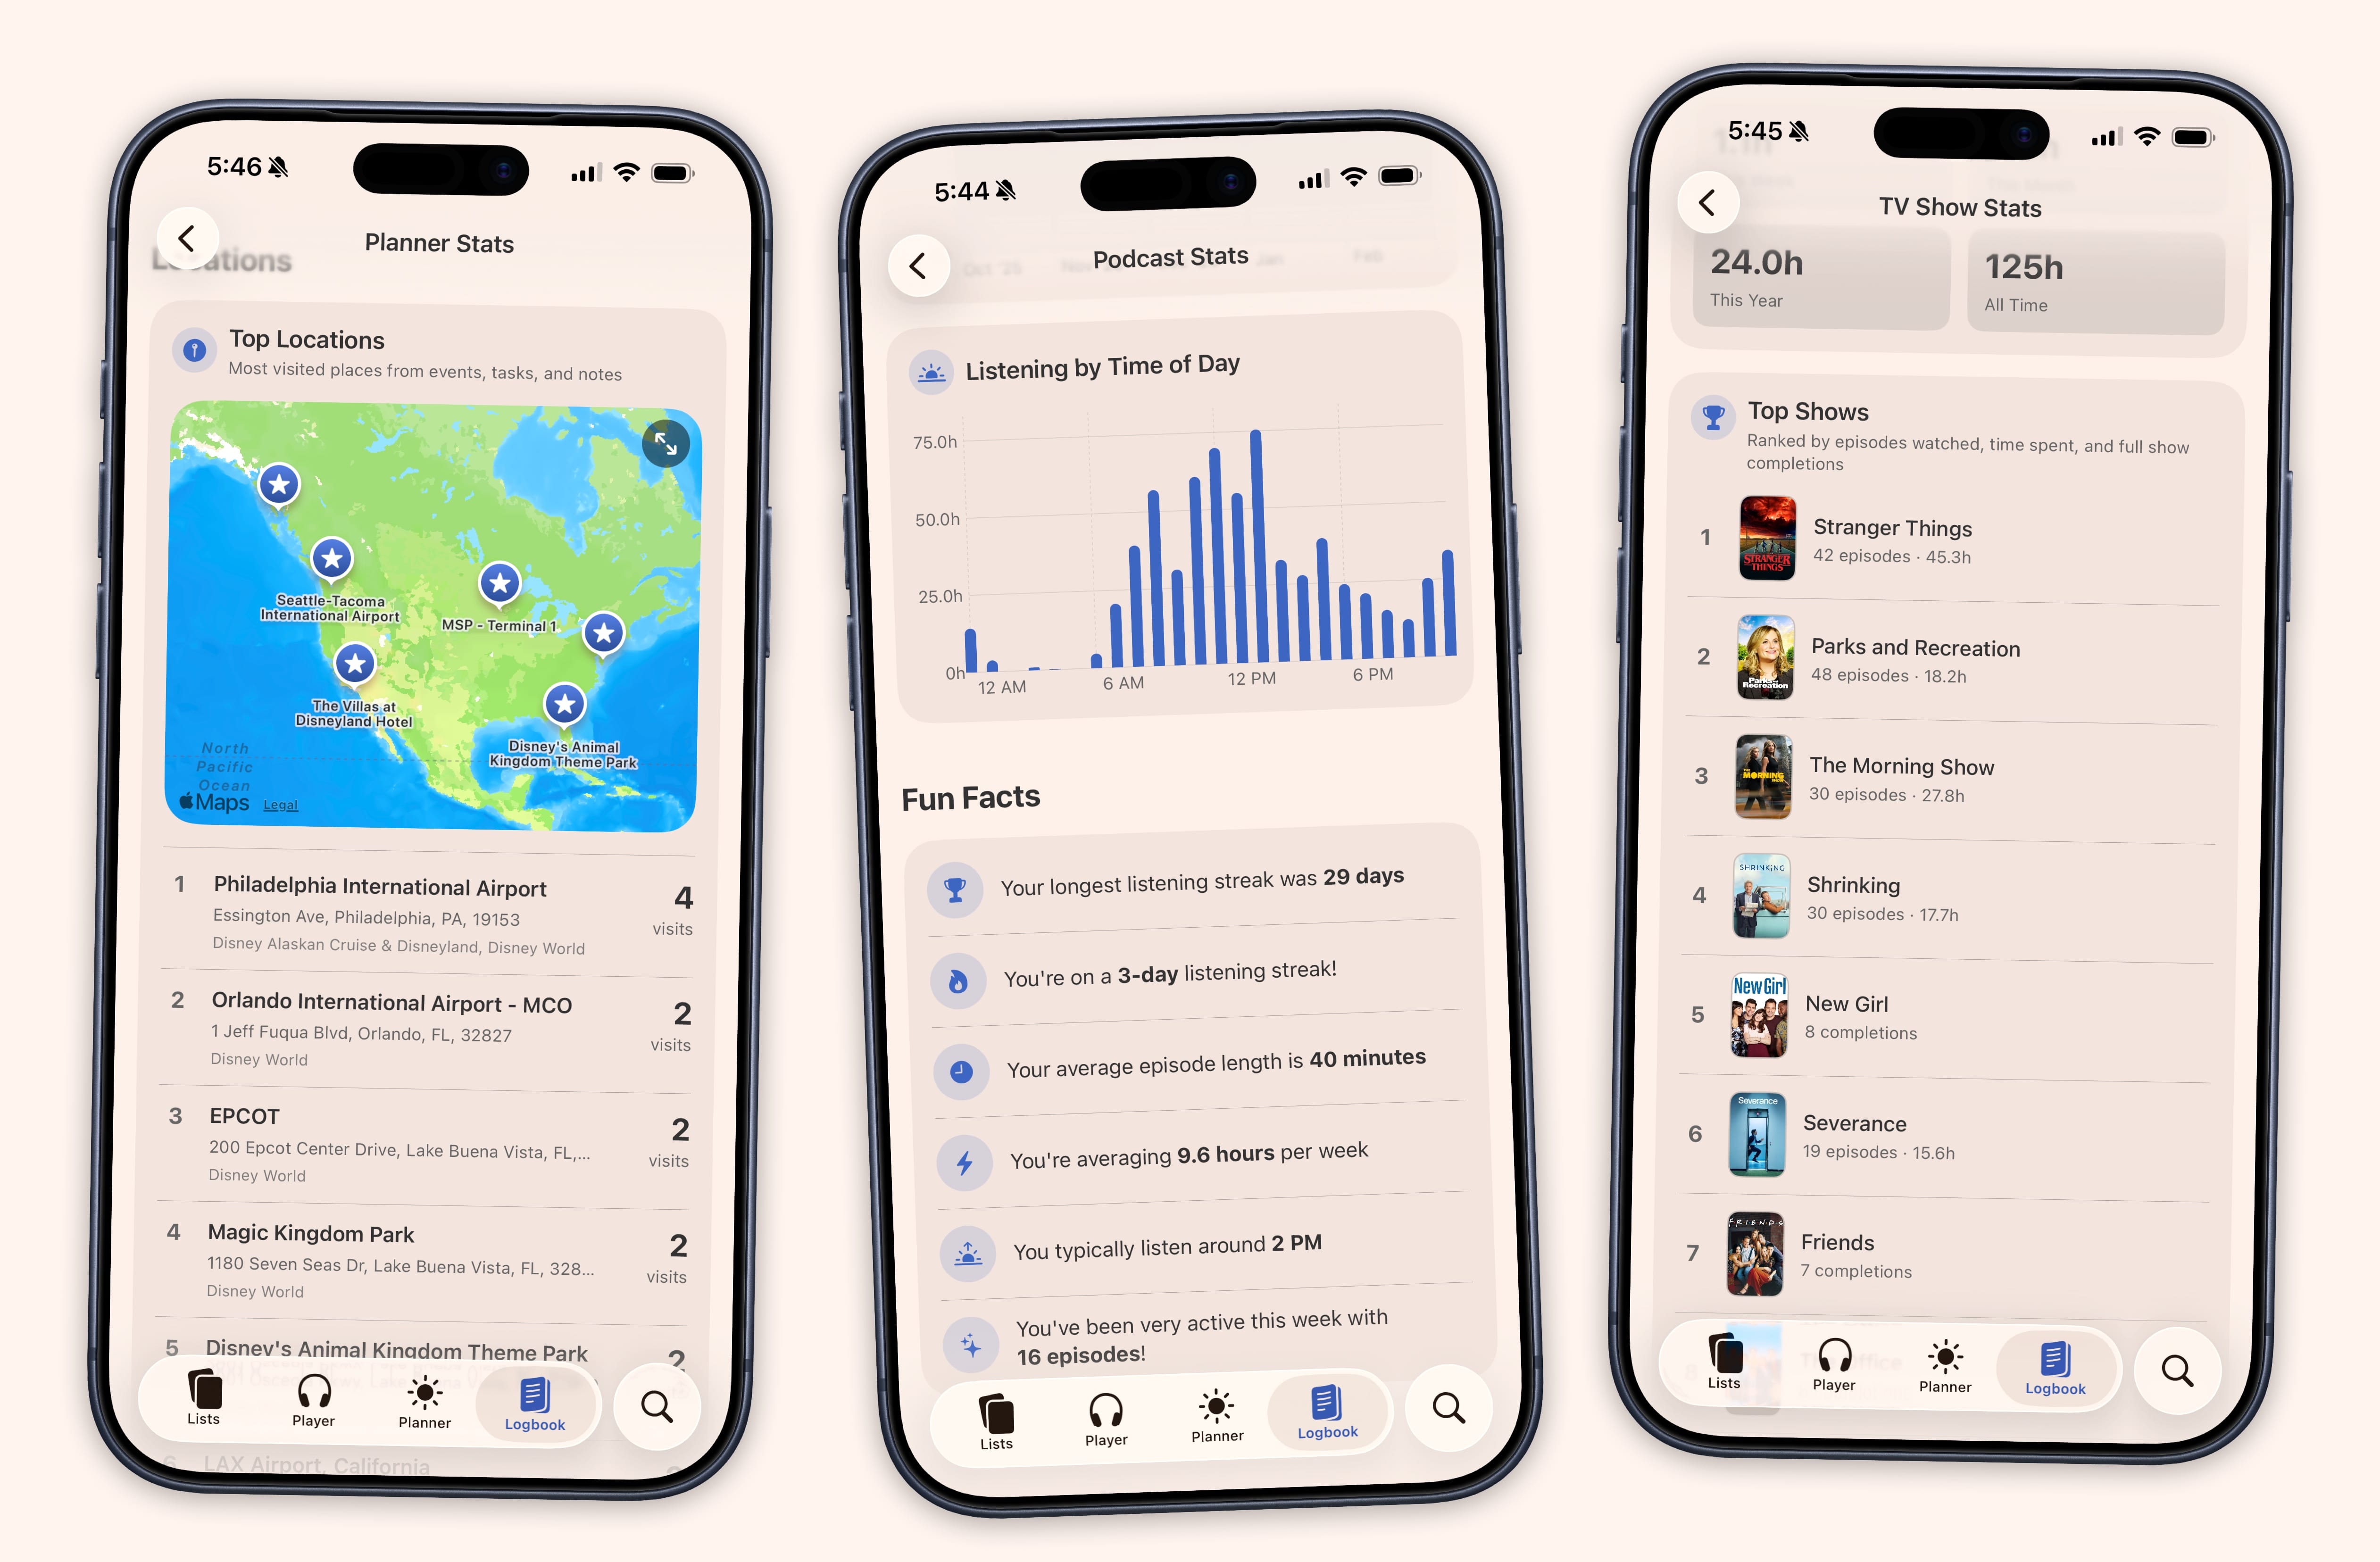
A Stats dashboard turns your downtime history into something you can actually see. An activity timeline shows your last twelve months at a glance. Each content type gets its own detail page with charts, top rankings, and genre breakdowns. TV shows reveal your peak binge day. Podcasts show your preferred listening time. Movies break down by genre and decade.
Every media type gets three sections: Summary, Habits, and Fun Facts. Summary shows your key numbers like episodes watched, hours listened, and movies logged, all broken down by week, month, year, and total. Habits reveals when and how you consume media. And Fun Facts delivers the insights you did not expect.
Stats also surface patterns you wouldn't notice on your own. Year-over-year comparisons, milestone markers like logging your hundredth podcast episode, and an interactive map that clusters your Planner events and tasks by location.
The fun facts are the part people share. “You are a weekend warrior — 68% of your TV watching happens on Saturday and Sunday.” “You have read 31% more books than this time last year.” “Your longest binge streak was 14 consecutive days during your Succession run.” These are generated from your data and they get more interesting the more you log.
Even your Planner gets stats. See your task completion rate, event frequency, and an interactive map showing your most-visited spots with visit counts. Custom categories you have created get the same treatment — if you track it, Sofa measures it.
And So Much More.
- Custom Date Editing
- Change the date on any Logbook entry so your history is accurate even when you log late.
- Location History
- See where your events and trips happened on an interactive map with visit counts.
- Notes
- Add personal notes to any item — thoughts, recommendations, or anything you want to remember.
- Shortcuts
- Log items to your Logbook from Shortcuts with a specific date — back-fill your history without opening the app.
- iCloud Sync
- Your library stays in sync across iPhone, iPad, Mac, and Apple Vision Pro.